Creating a Sales Dashboard Using Angular and Google Charts
May 8th, 2019 | By Jay Raj | 9 min read

In this tutorial, you'll learn how to create a sales dashboard using Angular and Google Charts. The tutorial assumes that you are familiar with basic Angular and JavaScript.
The source code from this tutorial is available on GitHub.
Getting Started With an Angular App
To get started with Angular, you need to install Angular CLI using Node Package Manager (npm):
npm install -g @angular/cli
Once you have the Angular CLI installed, you can use it to create an Angular boilerplate project.
ng new angular-sales-dashboard
The command above creates the Angular project boilerplate code.
Include Google Charts Script In Your Angular App
Use Google Charts to create the dashboard in this Angular app. Start by adding the Google Charts script files to our Angular app.
https://www.gstatic.com/charts/loader.js
Download the script above into the assets/js folder or use it directly by including it in the angular.json file.
Include the loader.js script in the script section of the angular.json file.
"scripts": [
    "src/assets/js/loader.js"
]
You'll be using the Google Charts script to create different charts. First, define it inside an Angular service module. This service module can be used to access Google Charts all across the Google Charts module.
Creating The Google Charts Service Module
Let's start by creating a module for Google Charts from the command prompt in the following command:
ng g module google-chart
This creates a module called GoogleChartModule inside the src/app/google-chart/google-chart.module.ts file. Here is how it looks:
import { NgModule } from '@angular/core';
import { CommonModule } from '@angular/common';

@NgModule({
  declarations: [],
  imports: [
    CommonModule
  ],
  exports: [],
  providers : []
})
export class GoogleChartModule { }
Inside the Google-chart module, create another module called service.
ng g module google-chart/service
This will create a service folder inside the Google-chart folder. This service folder contains the ServiceModule file called service.module.ts. Here is how it looks:
import { NgModule } from '@angular/core';
import { CommonModule } from '@angular/common';

@NgModule({
  declarations: [],
  imports: [
    CommonModule
  ]
})
export class ServiceModule { }
ServiceModule will have the Angular service, which will be utilized to access the Google Charts library. Let's create the Angular service inside the service module.
ng g service google-chart/service/google-chart
The command above creates a service file called google-chart.service.ts. Declare a global variable called Google above the @Injectable decorator. It refers to the Google Charts library script included in the Angular app.
declare var google: any;
Next, define a private variable Google inside the GoogleChartService service.
Set its value to the global Google variable and return it with the help of a method inside the GoogleChartService class. Here is how the google-chart.service.ts file looks:
import { Injectable } from '@angular/core';
import { ServiceModule } from './service.module';

declare var google: any;

@Injectable({
  providedIn: ServiceModule
})
export class GoogleChartService {
  private google : any;
  constructor() {
    this.google = google;
  }

  getGoogle(){
    return this.google;
  }
}
As you can notice in the code above, the provided in the GoogleChartService is being set to the ServiceModule. It indicates that the GoogleChartService is available only inside the ServiceModule.
To use the Service module inside the GoogleChartModule, you only need to import it inside the google-chart.module.ts file.
import { NgModule } from '@angular/core';
import { CommonModule } from '@angular/common';

@NgModule({
  declarations: [],
  imports: [
    CommonModule,
    ServiceModule
  ],
  exports: [],
  providers : []
})
export class GoogleChartModule { }
Creating The Line Chart Component
You'll be using GoogleChartService to create the line chart.
ng g component google-chart/line-chart
This creates a LineChartComponent inside google-chart/line-component. The line-chart.component.ts file should look like this:
import { Component, OnInit } from '@angular/core';

@Component({
  selector: 'app-line-chart',
  templateUrl: './line-chart.component.html',
  styleUrls: ['./line-chart.component.css']
})
export class LineChartComponent implements OnInit {

  constructor() {
  }

  ngOnInit() {
  }
}
Let's import the GoogleChartService inside the line-chart.component.ts file.
import { GoogleChartService } from '../service/google-chart.service';
And reference it inside the component constructor method.
constructor(private gChartService : GoogleChartService) {

}
Let's reference the Google Charts library as a private variable and use it to initialize the core packages for creating the line chart inside the LineChartComponent constructor method.
  private gLib: any;

  constructor(private gChartService : GoogleChartService) {
    this.gLib = this.gChartService.getGoogle();
    this.gLib.charts.load('current', {'packages':['corechart','table']});
    this.gLib.charts.setOnLoadCallback(this.drawChart.bind(this));
  }
Once the Google Charts library packages have been loaded, a callback method called drawChart will be triggered.
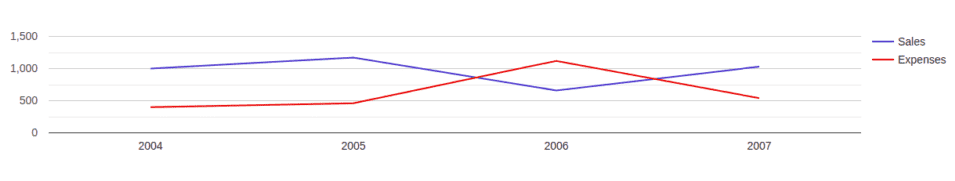
This drawChart method will contain the code to create the line chart. Here is what this method should look like:
  private drawChart(){
    let data = this.gLib.visualization.arrayToDataTable([
      ['Year', 'Sales', 'Expenses'],
      ['2004',  1000,      400],
      ['2005',  1170,      460],
      ['2006',  660,       1120],
      ['2007',  1030,      540]
    ]);

    let chart = new this.gLib.visualization.LineChart(document.getElementById('divLineChart'));

    chart.draw(data);
  }
Note: For the sake of this tutorial, you are using dummy hard-coded data. You can replace the data with a REST API endpoint or database service call per your project requirement.
As in the code snippet above, the drawChart method uses the Google Charts library referenced using the gLib variable to create the data table. Once the data table is prepared, you create a new chart using the LineChart method and pass in the container div to show the line chart.
Lastly, you draw the chart by passing the data to the draw method. The line-chart.component.ts file should look like this:
import { Component, OnInit } from '@angular/core';
import { GoogleChartService } from '../service/google-chart.service';

@Component({
  selector: 'app-line-chart',
  templateUrl: './line-chart.component.html',
  styleUrls: ['./line-chart.component.css']
})
export class LineChartComponent implements OnInit {

  private gLib: any;

  constructor(private gChartService : GoogleChartService) {
    this.gLib = this.gChartService.getGoogle();
    this.gLib.charts.load('current', {'packages':['corechart','table']});
    this.gLib.charts.setOnLoadCallback(this.drawChart.bind(this));
  }

  ngOnInit() {

  }

  private drawChart(){
    let data = this.gLib.visualization.arrayToDataTable([
      ['Year', 'Sales', 'Expenses'],
      ['2004',  1000,      400],
      ['2005',  1170,      460],
      ['2006',  660,       1120],
      ['2007',  1030,      540]
    ]);

    let chart = new this.gLib.visualization.LineChart(document.getElementById('divLineChart'));

    chart.draw(data);
  }

}
And the line-chart.component.html file should look like so:
<div  id="divLineChart">

</div>
Using The Line Chart Component
You can use the LineChartComponent by exporting it from the GoogleChartModule.
Add the LineChartComponent to the exports in the google-chart.module.ts file:
import { NgModule } from '@angular/core';
import { CommonModule } from '@angular/common';
import { LineChartComponent } from './line-chart/line-chart.component';
import { ServiceModule } from './service/service.module';

@NgModule({
  declarations: [LineChartComponent],
  imports: [
    CommonModule,
    ServiceModule
  ],
  exports: [LineChartComponent],
  providers : []
})
export class GoogleChartModule { }
Now, you can use the LineChartComponent using the selector app-line-chart. Modify the app.component.html file to include the line chart component.
<app-line-chart></app-line-chart>
Save the above changes and start the Angular app. You'll see the Line chart rendered in the Angular app.
Creating the Pie Chart Component
Let's create the pie chart component for displaying some data in a pie chart. Start by creating a pie-chart component inside the Google-chart module.
ng g component google-chart/pie-chart
Next, let's import the GoogleChartService inside the PieChartComponent and load the required packages for creating the pie chart inside the constructor method. Here is how it looks:
import { Component, OnInit } from '@angular/core';
import { GoogleChartService } from '../service/google-chart.service';

@Component({
  selector: 'app-pie-chart',
  templateUrl: './pie-chart.component.html',
  styleUrls: ['./pie-chart.component.css']
})
export class PieChartComponent implements OnInit {

  private gLib: any;

  constructor(private gChartService : GoogleChartService) {
    this.gLib = this.gChartService.getGoogle();
    this.gLib.charts.load('current', {'packages':['corechart','table']});
    this.gLib.charts.setOnLoadCallback(this.drawChart.bind(this));
  }

  ngOnInit() {

  }

}
You also need to define the drawChart callback method, which handles the processing of data and drawing the pie chart. Here is how the pie-chart.component.ts file looks:
import { Component, OnInit } from '@angular/core';
import { GoogleChartService } from '../service/google-chart.service';

@Component({
  selector: 'app-pie-chart',
  templateUrl: './pie-chart.component.html',
  styleUrls: ['./pie-chart.component.css']
})
export class PieChartComponent implements OnInit {

  private gLib: any;

  constructor(private gChartService : GoogleChartService) {
    this.gLib = this.gChartService.getGoogle();
    this.gLib.charts.load('current', {'packages':['corechart','table']});
    this.gLib.charts.setOnLoadCallback(this.drawChart.bind(this));
  }

  ngOnInit() {

  }

  private drawChart(){
    let chart = new this.gLib.visualization.PieChart(document.getElementById('divPieChart'));
    let data = new this.gLib.visualization.DataTable();
    data.addColumn('string', 'Accessories');
    data.addColumn('number', 'Quantity');
    data.addRows([
      ['Computers', 3],
      ['Hard Drives', 6],
      ['Printers', 4],
      ['Monitors', 5],
      ['RAM', 2]
    ]);

    let options = {'title':'Sales Info'};

    chart.draw(data, options);
  }

}
Once your PieChartComponent is ready, export the component from the GoogleChartModule. The google-chart.module.ts should look similar to this:
import { NgModule } from '@angular/core';
import { CommonModule } from '@angular/common';
import { LineChartComponent } from './line-chart/line-chart.component';
import { ServiceModule } from './service/service.module';
import { PieChartComponent } from './pie-chart/pie-chart.component';


@NgModule({
  declarations: [LineChartComponent, PieChartComponent],
  imports: [
    CommonModule,
    ServiceModule
  ],
  exports: [LineChartComponent, PieChartComponent],
  providers : []
})
export class GoogleChartModule { }
So, the PieChartComponent is ready to use. You'll use it along with LineChartComponent inside AppComponent to create the dashboard.
Creating the Table Chart Component
You'll also be creating a table chart component for rendering the data in tabular format. Create a table-chart component inside the Google-chart module.
ng g component google-chart/table-chart
The code for this component is quite similar to the two components you created earlier. It also uses the GoogleChartService to access the Google library and create the tabular chart. Here is how the table-chart.component.ts file looks :
import { Component, OnInit } from '@angular/core';
import { GoogleChartService } from '../service/google-chart.service';

@Component({
  selector: 'app-table-chart',
  templateUrl: './table-chart.component.html',
  styleUrls: ['./table-chart.component.css']
})
export class TableChartComponent implements OnInit {

  private gLib: any;

  constructor(private gChartService : GoogleChartService) {
    this.gLib = this.gChartService.getGoogle();
    this.gLib.charts.load('current', {'packages':['corechart','table']});
    this.gLib.charts.setOnLoadCallback(this.drawChart.bind(this));
  }
  ngOnInit() {

  }

  private drawChart(){
    let chart = new this.gLib.visualization.Table(document.getElementById('divTableChart'));
    let data = new this.gLib.visualization.DataTable();

    data.addColumn('string', 'Year');
    data.addColumn('number', 'Sales');
    data.addColumn('number', 'Expenses');

    data.addRows([
      ['2004', 1000, 400],
      ['2005', 1170, 460],
      ['2006', 660, 1120],
      ['2007', 1030, 540]
    ]);

    let options = {'title':'Sales Tabular Data',
                       'width': '100%',
                       'height': '100%'};
    chart.draw(data, options);
  }

}
Export the TableChartComponent inside the GoogleChartModule.
// google-chart.module.ts

import { NgModule } from '@angular/core';
import { CommonModule } from '@angular/common';
import { LineChartComponent } from './line-chart/line-chart.component';
import { ServiceModule } from './service/service.module';
import { PieChartComponent } from './pie-chart/pie-chart.component';
import { TableChartComponent } from './table-chart/table-chart.component';

@NgModule({
  declarations: [LineChartComponent, PieChartComponent, TableChartComponent],
  imports: [
    CommonModule,
    ServiceModule
  ],
  exports: [LineChartComponent, PieChartComponent, TableChartComponent],
  providers : []
})
export class GoogleChartModule { }
Now, since you have the required components ready, you can use them to create the sales dashboard.
Creating The Sales Dashboard
You'll be using Bootstrap for styling the dashboard. Let's install it using npm.
npm install bootstrap --save
Once you have Bootstrap installed in your app, reference the Bootstrap style in the angular.json file for getting Bootstrap styles all across the Angular app.
"styles": [
   "src/styles.css",
   "node_modules/bootstrap/dist/css/bootstrap.min.css"
]
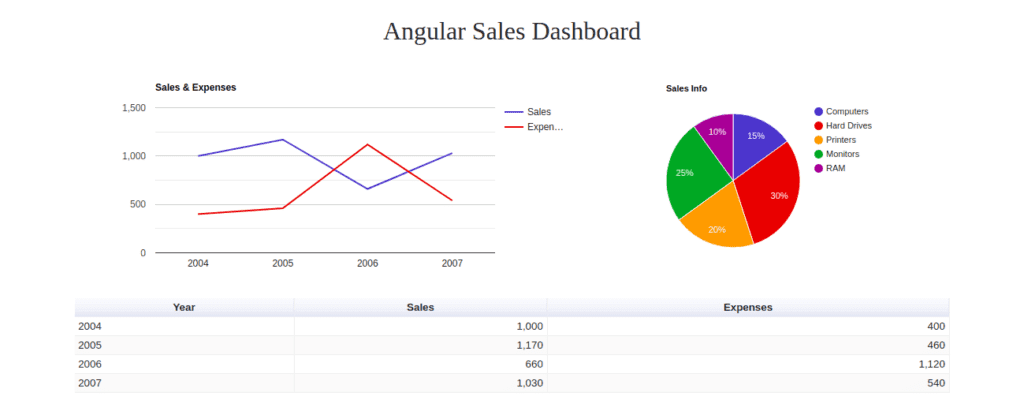
Add the following HTML code to app.component.html for rendering all the charts in the dashboard.
<div class="container">
    <div class="header">
        <h2>
            Angular Sales Dashboard
        </h2>
    </div>

    <div class="row">
        <div class="col-7">
            <app-line-chart></app-line-chart>
        </div>
        <div class="col-5">
            <app-pie-chart></app-pie-chart>
        </div>
    </div>
    <div class="row">
        <div class="col-12">
            <app-table-chart></app-table-chart>
        </div>
    </div>
  </div>
Save the above changes and restart the Angular app. You will have the Angular sales dashboard rendered in the browser.
Conclusion
You have learned how to create a basic sales dashboard using Angular 7 and the Google Charts library. You learned how to develop modules in Angular and use them in other modules. This may be useful to incorporate in your future projects.
Lastly, if you want to learn how you can secure your Angular source code against theft and reverse engineering.
Jscrambler
The leader in client-side Web security. With Jscrambler, JavaScript applications become self-defensive and capable of detecting and blocking client-side attacks like Magecart.
View All ArticlesMust read next
How To Prevent Customer Journey Hijacking and Increase Holiday Sales
In this post, we'll explore how Customer Journey Hijacking affects E-commerce retailers, and how they can protect their businesses against this threat.
December 23, 2021 | By Jscrambler | 3 min read
ICO Case Study | Tackling Cryptojacking with Real-time Webpage Monitoring
UK’s Information Commissioner’s Office (ICO) website was caught serving the CoinHive crypto miner to its users and it wasn't the only website affected. What could have been done?
February 14, 2018 | By Pedro Fortuna and Paulo Silva | 8 min read
