Debugging Tips for Vanilla JavaScript Developers
February 18th, 2025 | By Ezekiel Lawson | 13 min read

Finding and fixing mistakes in your code is known as debugging, a skill every JavaScript developer needs. Whether you are new to coding or have been at it for years, errors are bound to happen. They might be small, like a missing semicolon, or more significant, like your program not working as expected. Knowing how to handle these problems can save you time and frustration.
This guide will provide practical debugging tips tailored to Vanilla JavaScript developers. From understanding common errors to using browser tools effectively, you will gain good insights to tackle these issues confidently and improve your code.
Before we get into the tips for debugging JavaScript, let’s take a step back and start with the basics. It’s important to understand debugging errors and learn about the common ones you might encounter in your projects. This will give you a solid foundation and make it easier to follow along with the rest of the article.
What is Debugging in JavaScript?
Debugging is the process of finding and fixing problems, called bugs, in a software program. It means carefully examining the code to determine why it’s not working as it should and then solving those problems to make everything run smoothly.
Understanding Common JavaScript Errors
When working with JavaScript, it’s important to know that running into errors is completely normal; it is just part of the journey. Sometimes, these errors can be tricky, especially when working on a project with a deadline so close. You might hit a strange bug that takes longer to fix than expected, which can feel frustrating or even make you panic.
The first step in debugging is to understand the problem, and the second is to fix it step by step. Once you approach it this way, things will feel much more manageable. Let’s start by looking at some common JavaScript errors and their meaning so you’re better prepared to handle them.
Some common errors we can encounter in JavaScript are:
1. Syntax Error:
This error happens when JavaScript can’t understand your code because something is written incorrectly. It’s similar to making grammar mistakes in a sentence. Common examples of this error include missing or mismatched brackets, parentheses, or quotation marks. These small mistakes can cause complications and stop your code from running as expected.
    function sayHello(name {
      if name = "" {
        console.log("Hello" name!)
      else {
        console.log(Hello, name)
      }
    sayHello("John"
In the code example above, the function definition is missing a closing parenthesis ), the if condition is missing `parentheses ()` and uses `=` instead of `===` for comparison, the console.log statement is missing a comma between `"Hello"` and name and quotes around `"Hello"` in the else block, several lines are missing semicolons at the end, and the function call is missing a closing parenthesis ).
Here is an example of what you will encounter when you call the function:
Uncaught SyntaxError: Unexpected token '{'Correct Code Version:
function sayHello(name) {
  if (name === "") {
    console.log("Hello, Stranger");
  } else {
    console.log("Hello, " + name + "!");
  }
}

sayHello("Maria");
sayHello("");
Hello, Maria
Hello, Stranger2. Reference Error:
This error occurs when you try to use a variable or function that has yet to be defined.
console.log(examScore); Code Output:
ReferenceError: examScore is not definedCorrect Code Version:
let examScore = 100;
console.log(examScore);
Code Output:
1003.Type Error:
Type is an error that pops up when you try to do something that isn’t allowed with the type of data you’re working with. For instance, trying to call a non-function in the code example below:
let name = "Joseph Mike";

try {
  name();
} catch (error) {
 console.error("TypeError:", error.message);
}
Code Output:
TypeError: name is not a functionCorrect Code Version:
let name = "Clara Mitchell";
console.log("The name is:", name);
Code Output:
The name is: Clara MitchellThese are the most common errors developers encounter when building programs, but other types of errors occur in different situations. While these errors are important, they can be too complex to cover in detail here. This guide provides a detailed breakdown of the common errors developers encounter.
Debugging Tips for Vanilla JavaScript Developers
Debugging is an important skill for anyone working with JavaScript. It helps you find and fix problems in your code. You can easily solve issues and work with less strength using the right tools and simple techniques. Here are some helpful tips for debugging and keeping your code running smoothly.
Use Browser Developer Tools
If you want to make debugging easier, browser developer tools are one of the best things to use. These tools are built right into your browser and can help you find and fix problems in your code.
One really helpful feature is setting breakpoints. This means you can pause your code at specific lines to see what’s happening step by step. You can check the values of variables, see how the code is running, and figure out where things are going wrong.
.png)
.png)
There’s also the Elements tab, where you can view and edit your page's structure (HTML) and design (CSS) in real time. If you’re working with data from the Internet, the Network tab helps you check if requests are working properly and show how long things take to load.
.png) The browser’s developer tools also include a Network tab, which is incredibly useful for debugging API calls or data fetching. It allows you to monitor network requests, view their status, inspect the data being sent and received, and identify any errors or delays in the process.
The browser’s developer tools also include a Network tab, which is incredibly useful for debugging API calls or data fetching. It allows you to monitor network requests, view their status, inspect the data being sent and received, and identify any errors or delays in the process.
.png)
2. Use Console Tab
The Console tab is another handy feature. It shows error messages and lets you test small bits of code to see how they work. If your program is too complex, you can debug small sections at a time using the console.
.png)
Aside from using the console for debugging, you can also use it for educational purposes. You can learn more about function properties or array methods, as seen in the image below:
.png)
3. Use Online Debugging tools
I know I mentioned using developer tools for debugging, but online debugging tools like JSFiddle, CodePen, and StackBlitz are good tools for testing small snippets of code.
These tools are perfect for debugging because they allow you to easily share your code snippets with team members or online communities for feedback. You can also isolate a specific part of your code, test or debug it on these platforms, and make changes without affecting your entire project.
4. JavaScript Syntax Library
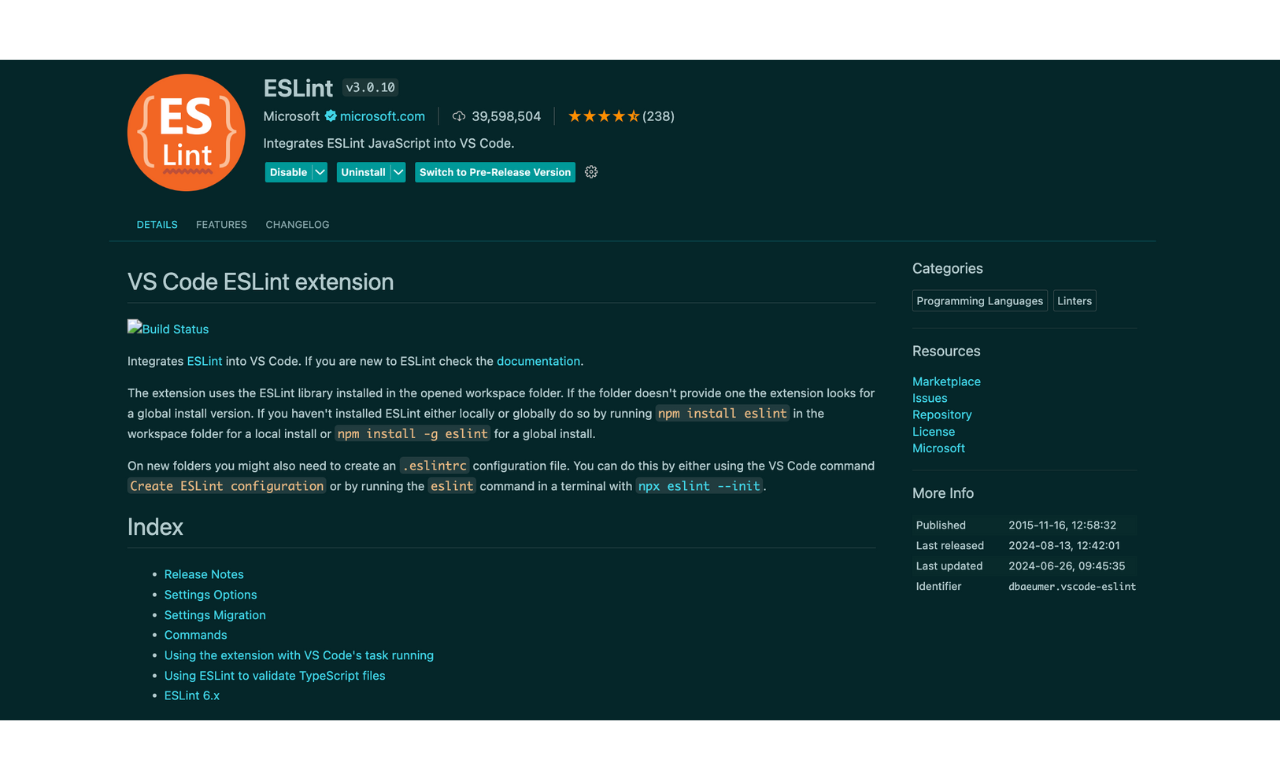
For developers new to JavaScript and still learning the syntax, ESLint is an excellent tool to consider. ESLint is a JavaScript utility that analyzes your code for syntax errors and other potential issues. It helps you catch common mistakes like missing brackets or typos—that are often simple to fix but can be frustrating if overlooked. By using ESLint, you can identify and resolve these bugs before running your code, saving time and reducing headaches.
You can simply install Eslint as a plugin in your VS code.
5. Use Updated Frameworks or Tools
This is a step many developers overlook when building their programs, but it is incredibly important. Before installing a framework or tool into your project, always use the latest version. Outdated frameworks can cause issues, as they might not include the latest bug fixes, performance improvements, or security patches provided by their developers.
Using an outdated version increases the chances of running into bugs already resolved in newer releases. These bugs could lead to problems during production or, even worse, before launching your project. Imagine spending hours debugging, only to discover the issue was due to an outdated tool.
6. Understand Browser Types
Sometimes, when building, you need to understand which browsers are compatible with your implementing functions. Not all browsers support every JavaScript feature, especially newer ones. For example, a function that works perfectly in Chrome might not work in older Internet Explorer or Safari versions without adjustments.
To avoid issues, always check browser compatibility for the features you’re using. Tools like Can I Use can help you quickly determine which browsers support specific JavaScript functions or APIs. This makes your project work easily for a wider user, regardless of their browser.
7. Use Online Resources for Debugging
Whatever issue you face during development, remember that other developers have likely encountered the same problem. The solutions they used to fix those issues are often shared in documentation, forums, or online resources. Official documentation is a reliable starting point, as it provides detailed explanations and examples directly from the creators of the tools or frameworks you are using.
Platforms like Stack Overflow, GitHub discussions, MDN web docs, or blog articles can offer practical advice and step-by-step solutions to fix these issues.
8. Take a Break and Stay Calm
Lastly, this may sound funny, but it’s very true if you are stuck on a bug, take a break and relax your mind. A relaxed mind is a productive mind. Stepping away from the problem gives you a chance to clear your head, and when you come back, you’ll often see the issue from a fresh perspective. Sometimes, the solution becomes obvious once you’ve had time to reset and think calmly. Debugging is just as much about your mindset as it is about your skills.
Conclusion
Debugging in JavaScript requires patience, a clear understanding of the issue, and the right tools and techniques. In this article, I have shared some tips to help you debug your code with ease. Remember, the most effective approach to debugging is to first understand the problem and then fix it step by step.
Jscrambler
The leader in client-side Web security. With Jscrambler, JavaScript applications become self-defensive and capable of detecting and blocking client-side attacks like Magecart.
View All ArticlesMust read next
10 JavaScript Engines To Develop Your Own Mobile And Web Games
JavaScript has already proved its capacity when it comes to developing top-quality games. There are tons of game engine options that can fit your programming skills and needs. Do you know them all?
May 10, 2018 | By Jscrambler | 5 min read
Top 7 HTML, CSS and JavaScript Practice Projects to Level Up Your Developer Skills
Whether you're new to coding or you've been at it for a while, working on projects helps you solve real-world problems, sharpen your thinking, and build a portfolio that'll turn heads.
July 23, 2025 | By Abigail Amadi | 12 min read
