Jscrambler 101 — Profiling
October 23rd, 2019 | By Jscrambler | 9 min read

Welcome back to Jscrambler 101! A collection of tutorials on how to use Jscrambler to protect your JavaScript. This tutorial covers Jscrambler version 6.3.
Introduction
Last time, on Jscrambler 101 — Self-Healing, we explored a new anti-tampering approach that ensures that the app doesn't break when tampering is detected while regenerating the original code.
This time, we’re going to delve into a new Jscrambler feature: Profiling. We will explain why Profiling is a valuable feature for performance-critical apps, how you can use it in your own apps, and its main use cases.
Profiling
When protecting JavaScript, it's desirable to achieve the optimal balance between three key metrics: potency, resilience, and cost. The first two correlate to the overall strength of the code protection, while the last refers to eventual impacts on performance and code size.
Often, applying a strong set of protections to the whole source code doesn't affect the performance of the app. However, some applications tend to perform less than ideal when this is done. In those cases, we can reduce Cost manually using Code Annotations — specifying different protection templates to parts of the code that we know to be crucial to performance.
Jscrambler Profiling is a new way of achieving this goal effortlessly by understanding which parts of the code are performance-critical and applying the best transformations when you protect your code.
When To Use Profiling
Now that we understand the basics of Jscrambler Profiling, it begs the question: when should we use Profiling?
As a general rule, before using Profiling, you should protect your application normally and check if the protected app has any performance issues. If it doesn't, then there is no reason to use Jscrambler Profiling.
Setting Up Profiling
From Jscrambler version 6.3 onwards, Profiling can be set up both via the Web App and via the CLI. We'll cover both strategies step-by-step. If you intend to use the CLI, please don't skip the instructions on the Web App Setup, as they cover essential Profiling concepts.
We will be using the "Jscrambler HTML5 Racer" app as an example.
Initial Setup Using The Web App
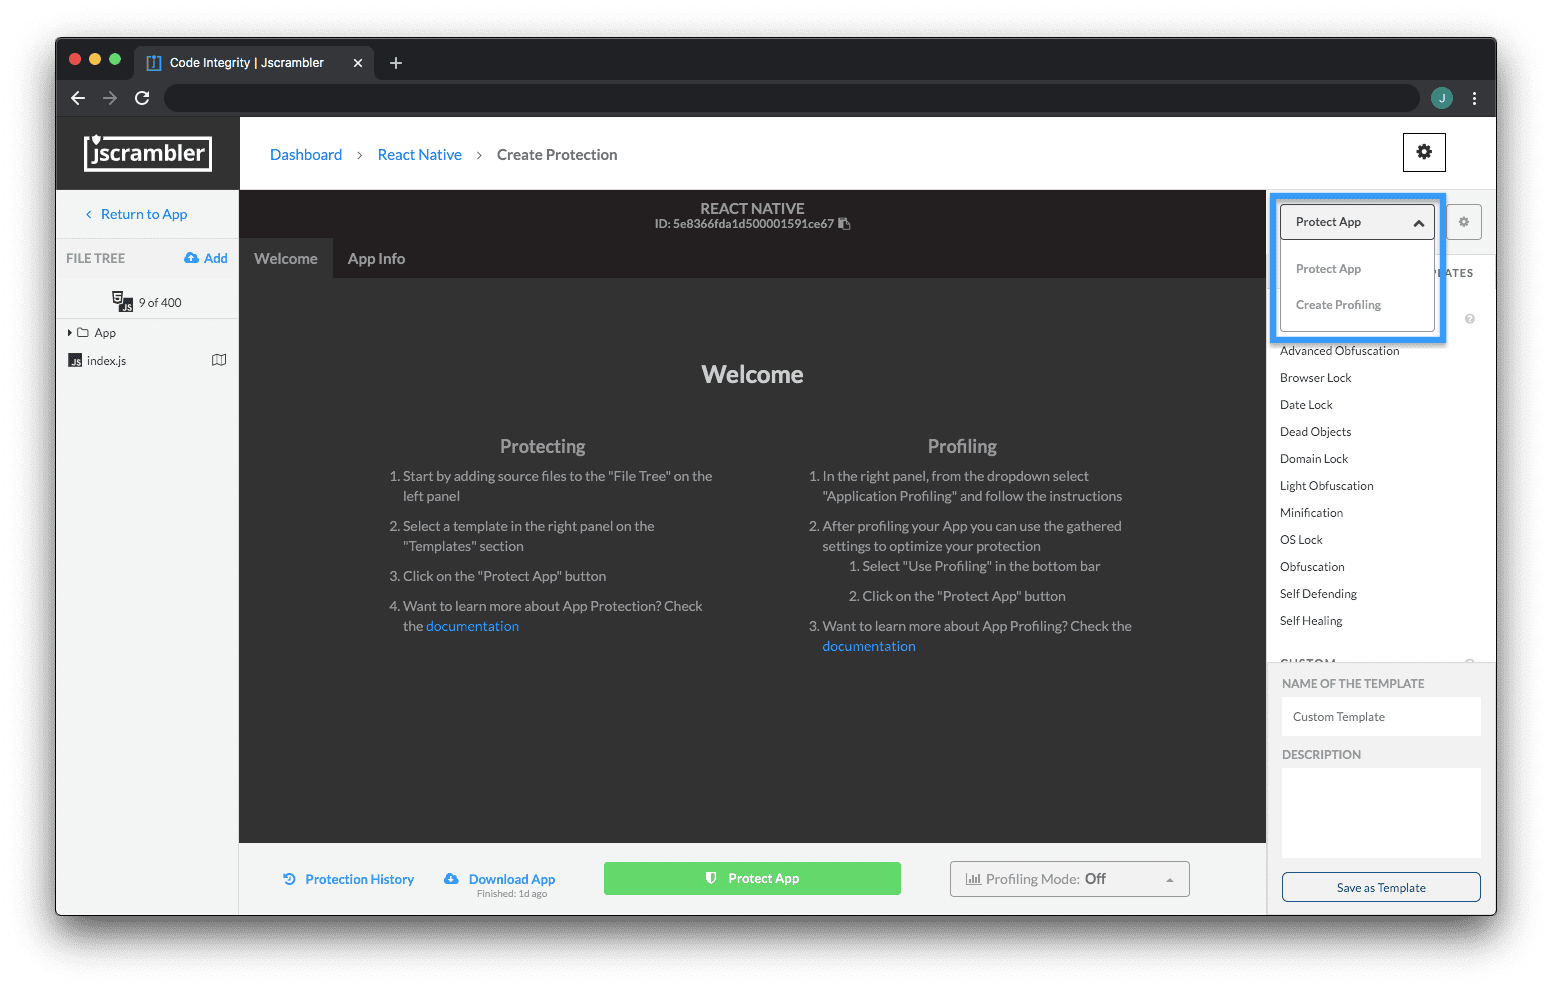
Once you're on your app's Code Protection Builder page on the Jscrambler Web App, switch from the "Protect App" context to "Create Profiling" by using the dropdown on the right sidebar as shown below:
 Now, we need to instrument our app. This step adapts the application to include tools that will measure the performance of the original application and report data back to Jscrambler. It's as simple as clicking "Instrument Application" and then downloading the newly instrumented app.
This instrumented app is not protected — do not send it to production! Instead, we will be using it to run the app in a testing environment so that it sends performance data to the Jscrambler profiler. To do so, let's click "Start Profiling".
From this point onwards, Jscrambler Profiling is actively receiving data whenever the profiled app is run. Our objective here is to run the app in a way that "exercises" as many functions of our code as possible, and/or the application "flows" that you believe to be less performant than usual.
So, let's unzip the previously downloaded instrumented app and run it in our browser.
Don't worry if the profiled app doesn't run smoothly — this slowdown is due to the overhead of measuring the properties of the application, and will not be present in the final protected version.
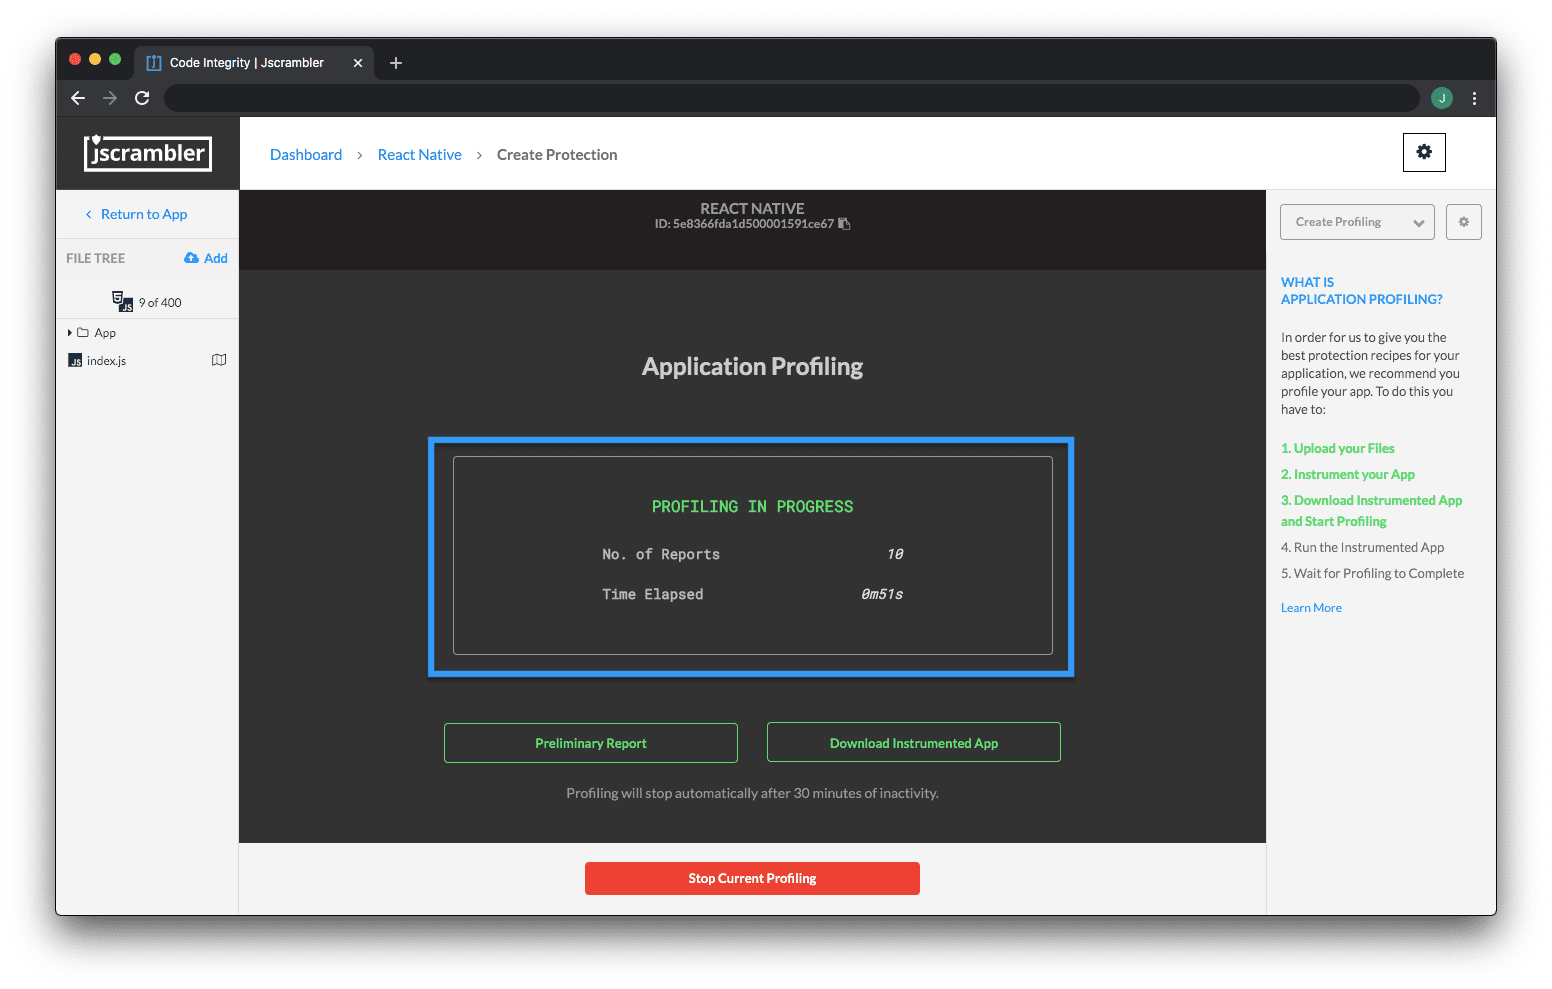
 As we do this, we can check the Jscrambler Profiling progress in the Web App. There, we will see a number of reports coming in as shown below — this is the collected performance data that will be essential to let Jscrambler figure out which parts of the code are performance-critical.
 You can also run your automated unit tests with the instrumented code so that all program flows are tested.
Once we consider that we have tested most of the application, we can click "Stop Current Profiling". Note that Profiling will also finish automatically if no data is received for 30 minutes.
Now that we have finished Profiling our app, the next step is to check the results. This step is the same for the Web App and CLI approaches.
Initial Setup Using The CLI
Note: The instructions for the CLI can also be seen in a small video.
Let's consider that we have a simple project with our example app within the following directory:
simpleRacerDemo/
|-- profiling-ready/
|-- protected/
|-- unprotected/
| |-- *.js
| |-- *.html
|-- jscrambler.json
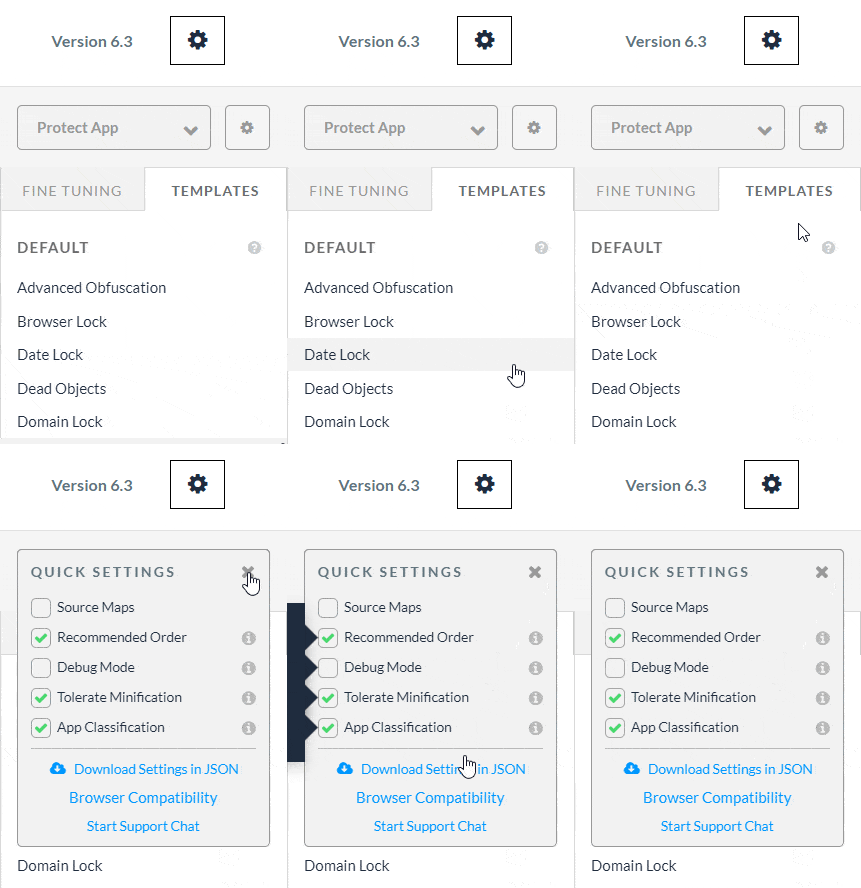
Our first step is to generate the jscrambler.json file through the Web App as shown below and place it on our root folder.
 Now, let's generate the instrumented version of our app (placing it on the profiling-ready/ folder) with the following command:
jscrambler -c jscrambler.json --instrument --output-dir profiling-ready/ unprotected/**/**
We're now ready to exercise the logic of our instrumented app. Let's initiate the Profiling process with:
jscrambler -c jscrambler.json --start-profiling
The next step is to start running tests that cover as many possible use cases of our app as possible (luckily, in our case, this means taking our Jscrambler race car for a spin!).
Once we're happy with our tests, let's stop the Profiling process with:
jscrambler -c jscrambler.json --stop-profiling
And there we have it! Our app is now Profiled and our next step is analyzing the Profiling results and fine-tuning them if needed.
Profiling Results
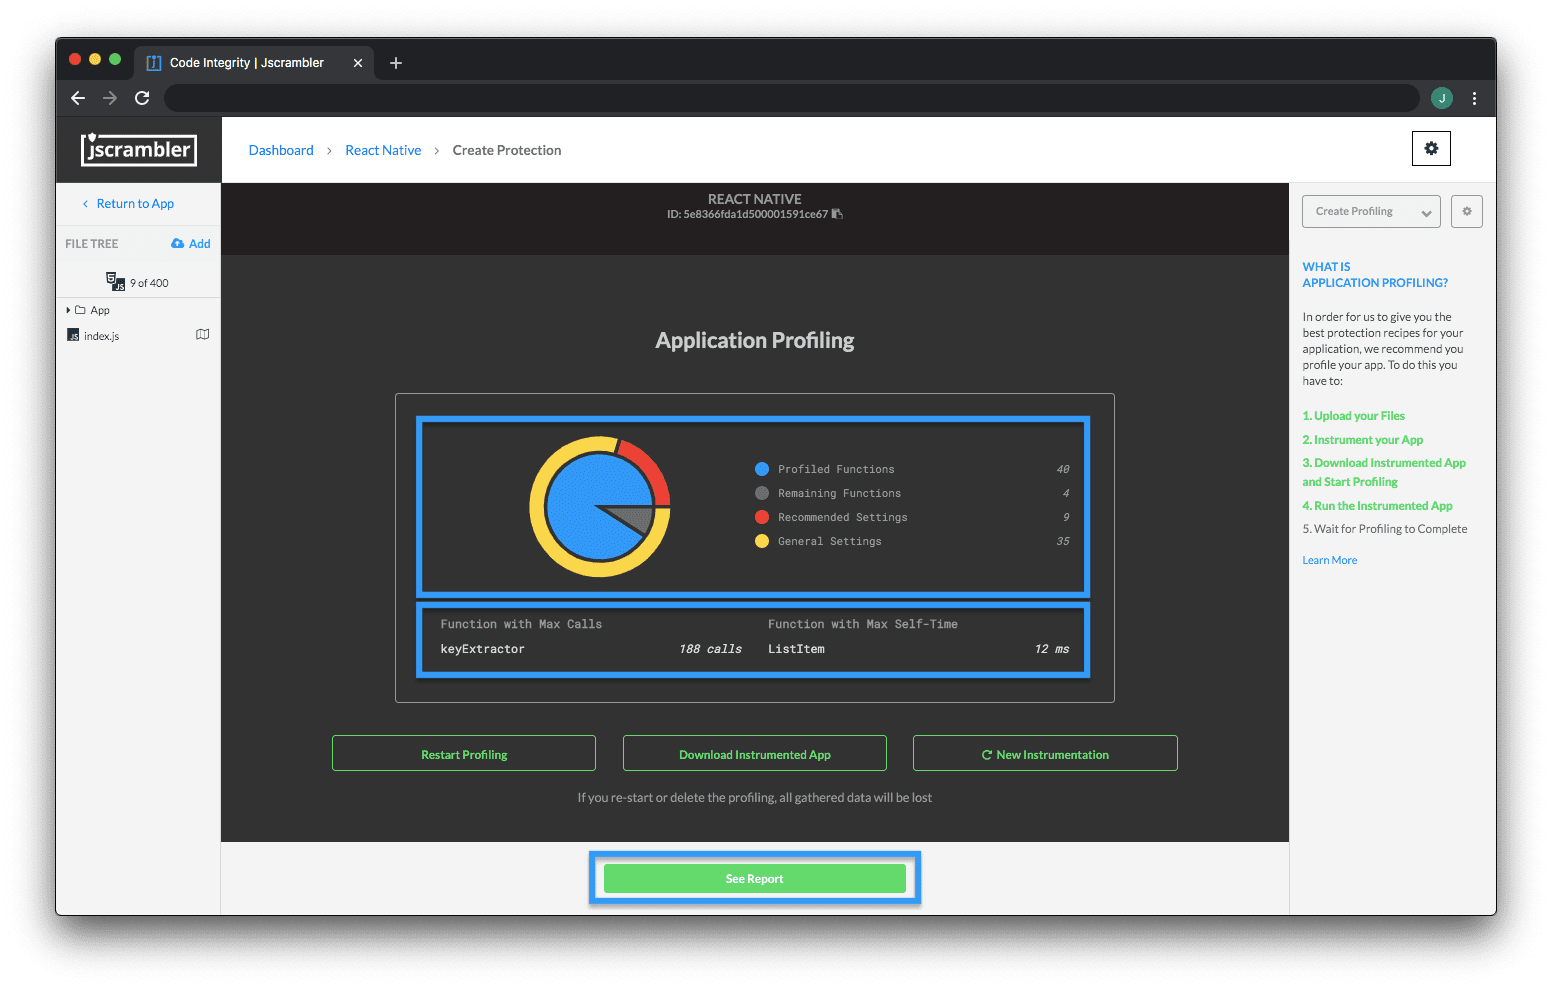
When we stop the Profiling process, Jscrambler will process all the collected data and we will see a summary of the Profiling results on the Web App.
On this updated screen, we see 4 main results:
Profiled Functions: Functions that were executed during Profiling;
Remaining Functions: Functions that were not executed during Profiling;
Recommended Settings: Functions that will be protected with the recommended settings by Profiling; for example, recommending the "Light Obfuscation" default template when a function is profiled as being performance-critical;
General Settings: Functions that will be protected with the general settings selected by you in the Protection Builder.
We can also click "See Report" to check each profiled function of your app and their Profiling recommendations.
On this page, we can change the template that Profiling suggested in each instance — perhaps we know that a certain function is security-critical but Profiling suggested a "Light Obfuscation" template; we can change this template to "General Settings" to ensure that this specific function will be protected with the overall protection settings.
 Note that you should upload Source Maps in cases where you are using transpilers or module bundlers, for example. Simply use the "Source Maps" toggle for this.
We will also see some references to "Annotations". This has to do with the different Profiling modes that can be used to apply Profiling recommendations when it's time to protect the app. Let's explore that next.
Protecting a Profiled App
Since Jscrambler version 6.3 onwards, there are 3 different Profiling modes: Annotations, Automatic, and Off.
Deciding which to choose depends on your objectives. The Annotations mode requires a one-time additional step where you have to annotate your code - meaning that Profiling results will persist after source code changes. The Automatic mode automatically applies Profiling results at protection time, but new Profiling is needed after source code changes.
So, as a rule of thumb, you will find the Automatic mode more useful when you’re first trying out Profiling or just wanting to see its results quickly. The Annotations mode is more beneficial when you want to easily integrate Profiling into your CI/CD pipeline.
The Off mode, as the name implies, doesn't use the Profiling results at all when protecting the code.
Choosing a Profiling mode and protecting the app varies depending on whether you're using the Web App or the CLI. Let's explore both below.
Protecting Profiled App Via the Web App
Let's change our Web App context from "Create Profiling" to "Protect App" using the dropdown on the top right. Now, we can choose a Profiling mode on the bottom dropdown, as shown below.
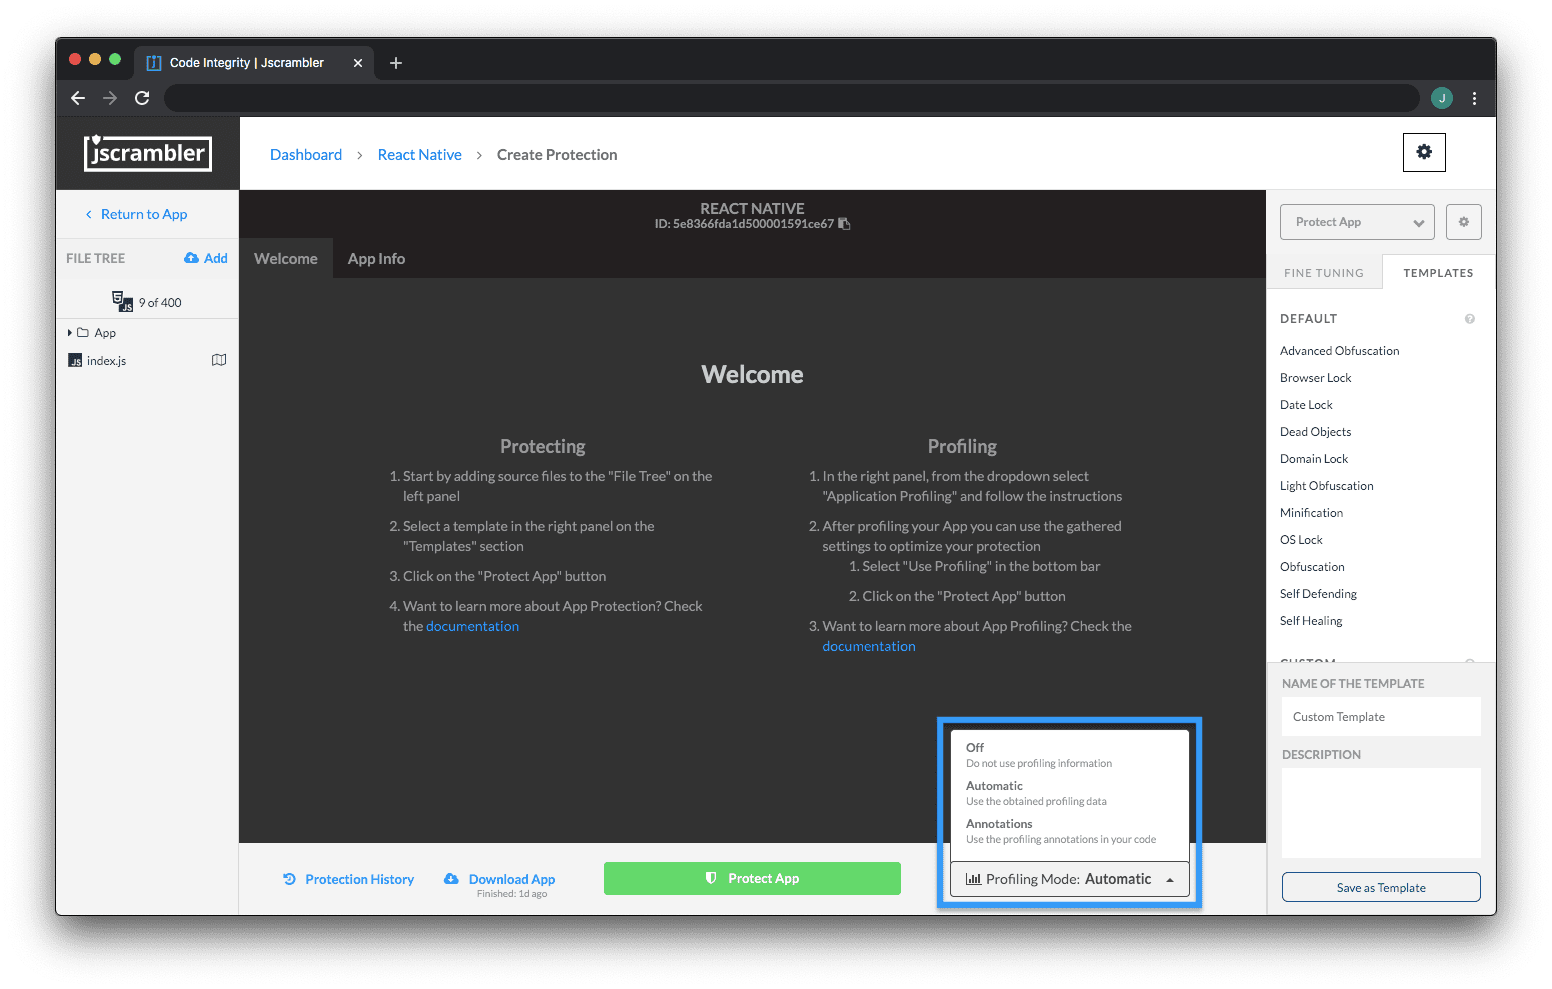 If we're using the Automatic mode, then our next step is simply to click "Protect App". Jscrambler will automatically apply the Profiling results and we'll get our protected code.
But if you want to use the Annotations mode, you'll have to get back to the Profiling Results page. Once there, you can either download a .csv file with all Annotations or copy them one by one, as shown below.
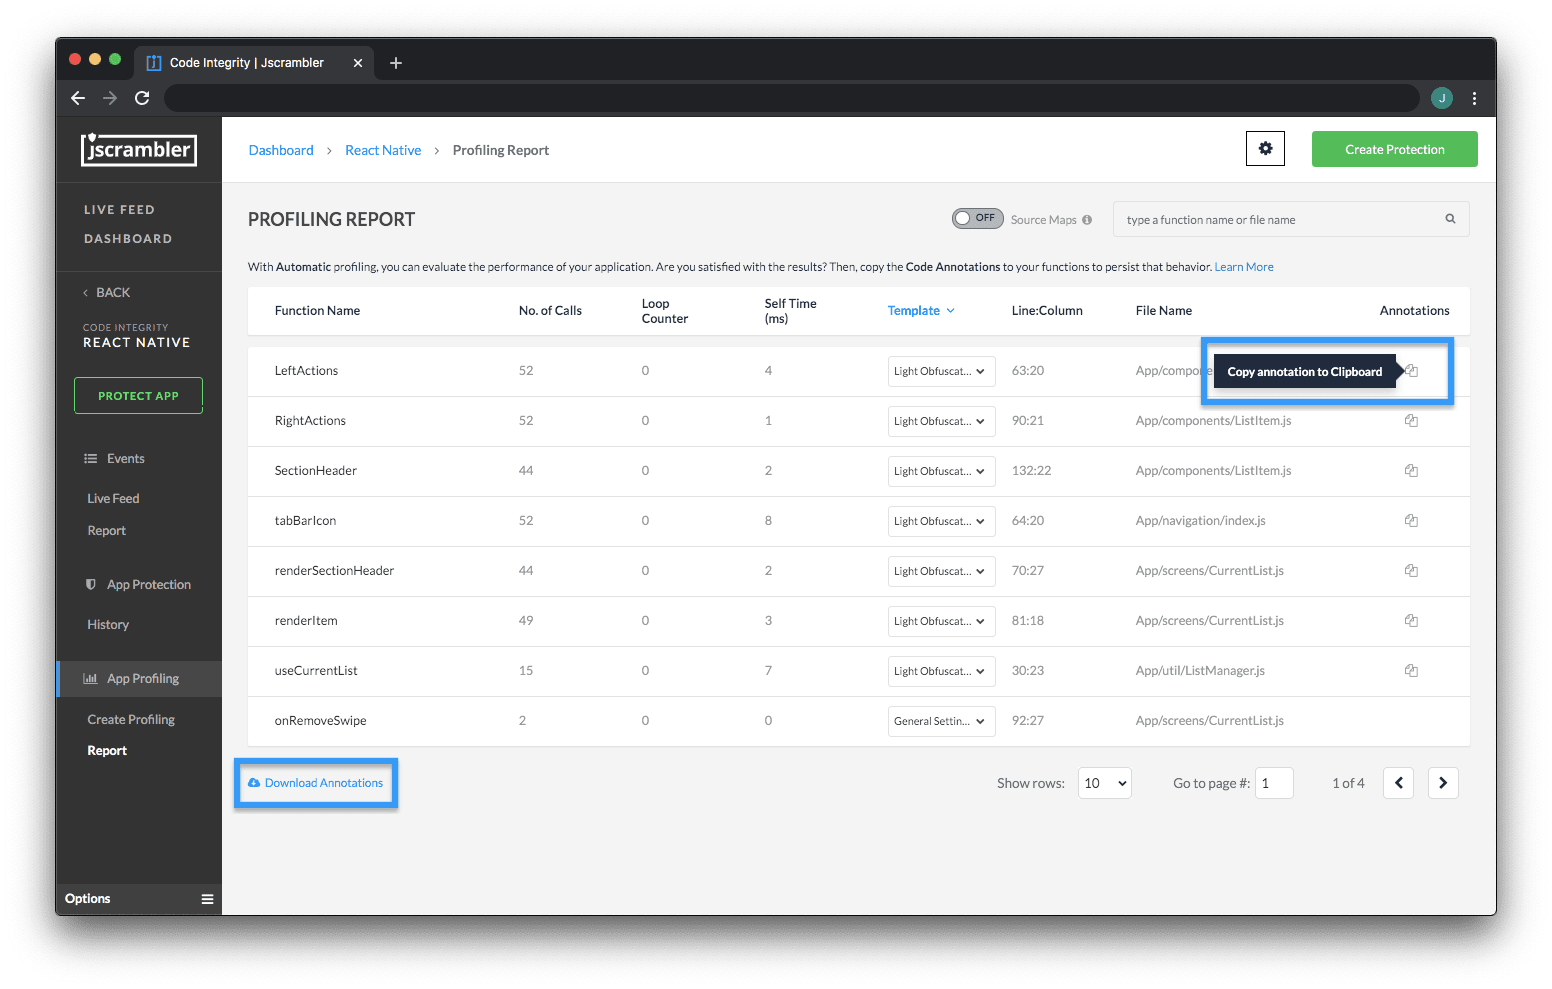 In both instances, you'll have clear instructions about the position (line/column) of the annotation. Let's look at an example:
"// @jscrambler profiling default lightObfuscation","highCostFunction",1:10,"index.js"
This means that we have to find function highCostFunction on line 1, column 10, and add the Profiling annotation so that the final result looks like this:
// @jscrambler profiling default lightObfuscation
function highCostFunction() {
 // performance-intensive logic
}
If you plan on using minifiers, consider adding these annotations as strings to avoid having them removed.
After placing the required annotations, we go back to the "Protect App" context, change the Profiling mode to Annotations, and click the "Protect App" button. Jscrambler will use our Profiling annotations and protect the code accordingly.
If, after this, we make some minor changes to our source code, we probably won't have to profile the app again — Profiling is necessary after major changes.
Now, all that's left for us to do is check the performance of our protected app.
Protecting Profiled App Via the CLI
Now that we understand the different Profiling modes, we are one command away from protecting our code.
So, if we want to use the Automatic mode, we use the command:
jscrambler -c jscrambler.json --profiling-data-mode automatic
This will create a new folder inside the protected/ folder with our newly protected app. Following our example, we can serve it locally with:
http-server protected/unprotected/Final App Test
We can now test our final app, which was protected using Profiling recommendations. Let's take our Jscrambler race car out of the garage for another spin:
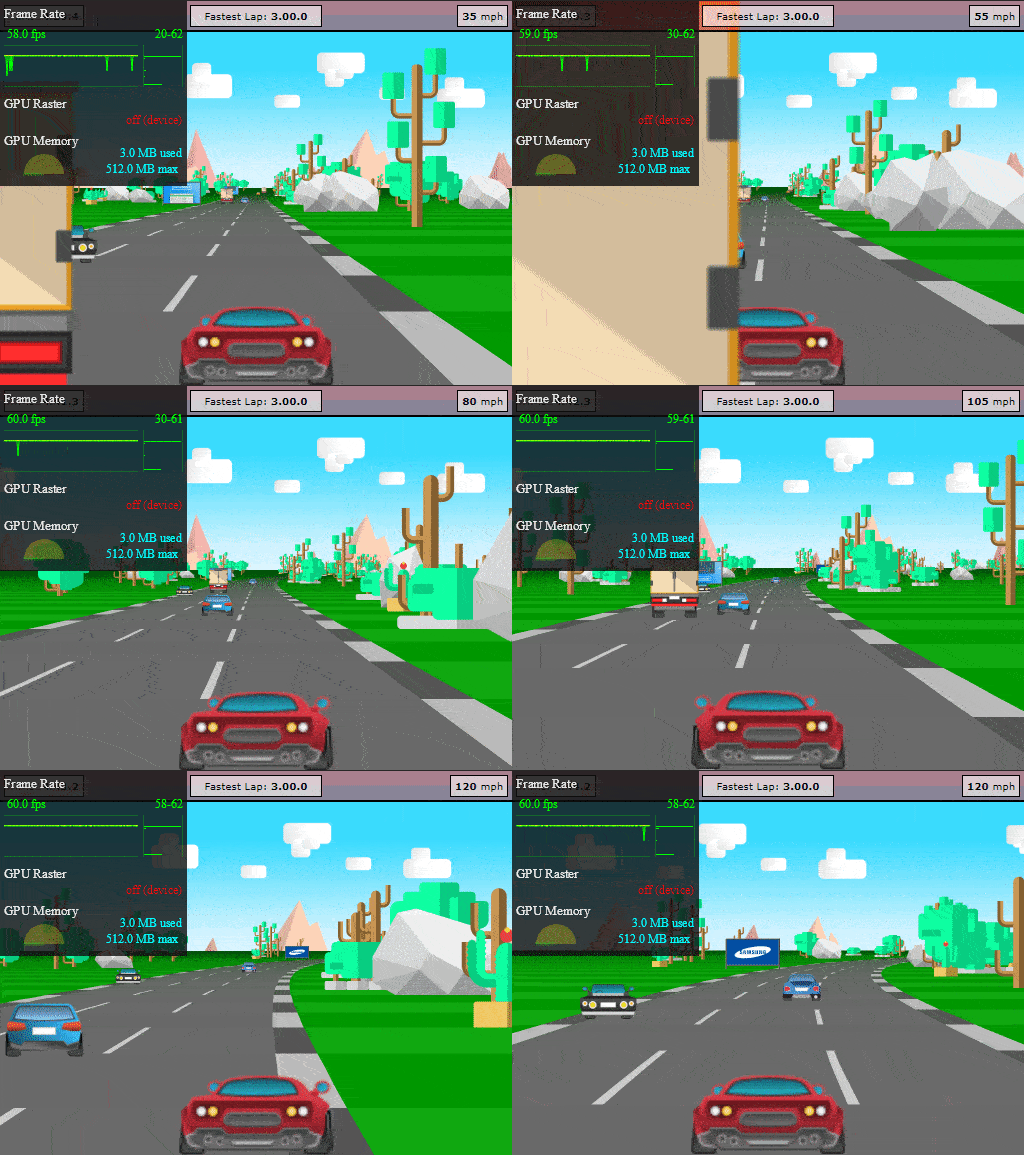 Not only does our HTML5 app run with great performance, but all of its code is also protected with an excellent potency-resilience-cost balance. Based on our tests for this HTML5 app, the average performance of the protected profiled app (measured in FPS) was 35% better than the un-profiled protected app.
And remember, our code is still protected with the best JavaScript protection available today:
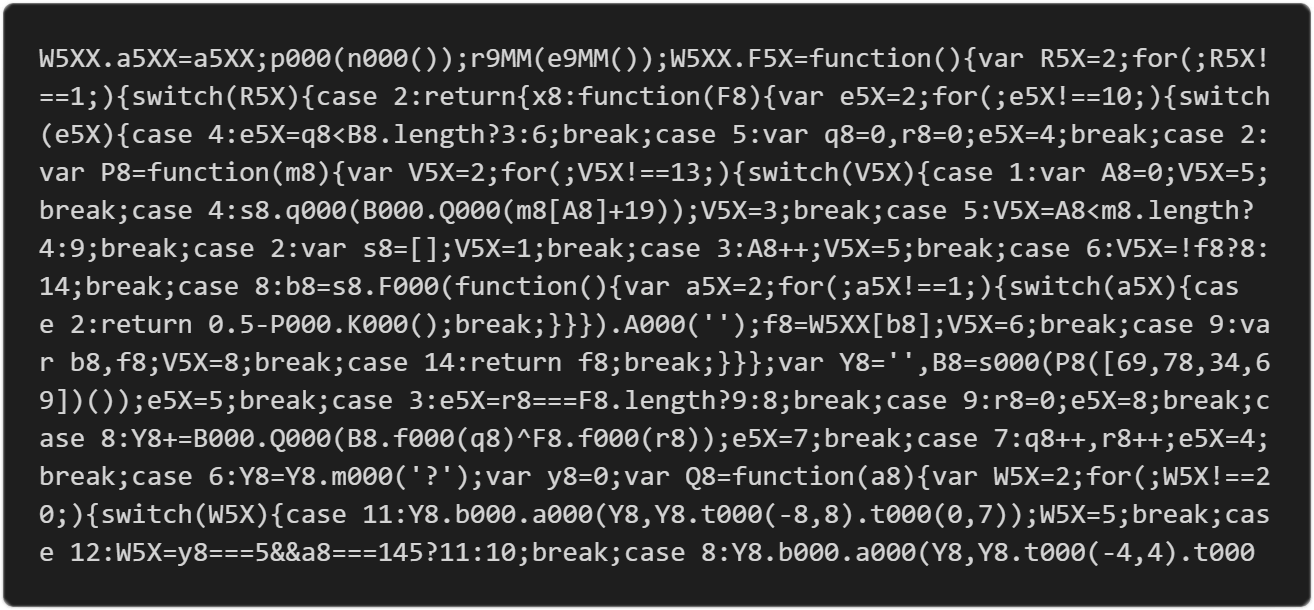 With Jscrambler Profiling doing all the heavy lifting to obtain most of the gain, we could now still use Code Annotations if we wished to tweak performance even further.
Conclusion
This sums up Jscrambler Profiling — a feature that enables effortlessly improving the performance of protected code in complex apps.
Feel free to proceed to one of our next 101 Tutorials:
Jscrambler 101 — Code Annotations (Code Performance)
Enjoy your testing and start protecting your Applications ASAP! If you have any additional questions, feel free to contact us.
Jscrambler
The leader in client-side Web security. With Jscrambler, JavaScript applications become self-defensive and capable of detecting and blocking client-side attacks like Magecart.
View All ArticlesMust read next
Jscrambler 101 — Self-Healing
Welcome back to our 101 tutorials on how to use Jscrambler to protect your JavaScript. This time, we’re going to explore our new layer: Self-Healing.
July 16, 2024 | By Jscrambler | 4 min read
Jscrambler 101 — Memory Protection
In this 101 tutorial, we explore Memory Protection - a new feature that increases the security of sensitive data in your web and mobile apps.
November 11, 2020 | By Jscrambler | 4 min read
