The Silent Bug: How JavaScript Memory Leaks Affect Web Performance
June 17th, 2025 | By Ezekiel Lawson | 12 min read

While browsing, you may notice that a website or app becomes slower over time. At first, everything loads quickly, but then the pages begin to slow down, the computer or phone starts using more memory, and eventually, the browser may even crash.
When this happens, many users assume their device is the problem, but the real issue is often hidden in the way the website or app manages memory. Some programs unintentionally retain memory they no longer need, which causes performance to decline over time and leads to memory leaks.
This article explains memory leaks, their impact on website performance, the causes of these leaks, and how to identify and resolve them.
How JavaScript memory leaks affect web performance
When building a website, one of the important things developers prioritize is performance. If a website is slow or unresponsive, visitors may get frustrated and leave. This can reduce traffic, lower sales, and make people less likely to use or visit your product or website.
One primary reason websites slow down over time is due to memory leaks. This happens when a website continues to use memory it no longer needs, instead of freeing it up. As a result, the browser stores more and more unnecessary data, leading to:
Increased memory usage – The website continues to consume memory, causing the computer to run slower.
Slow response and unresponsive – Pages don’t respond smoothly when scrolling or clicking buttons.
High CPU usage – The browser has to work harder to keep the website running.
Browser crashes – If too much memory is used, the browser may freeze or close unexpectedly.
Normally, JavaScript has a system called a garbage collector, which automatically frees up memory that’s no longer in use. But when a memory leak occurs, this process fails, and the memory stays occupied, slowing down the website or app.
Above, it’s mentioned that JavaScript's garbage collector is used when defining memory leaks. This might leave you curious about what exactly it does and how it helps manage memory.
What does the garbage collector do?
JavaScript has a built-in process called garbage collection that automatically removes unused data from memory. This helps prevent memory from filling up with unnecessary information.
JavaScript keeps track of variables, objects, and functions that are currently in use. When an object is no longer needed (no part of the code references it), the garbage collector removes it from memory.
Common causes and how to prevent memory leaks in JavaScript
Above, it’s mentioned that JavaScript uses a built-in process to manage memory. If the garbage collector automatically removes unused data, why do memory leaks still happen?
Here’s the key issue: while the garbage collector runs in the background, coding mistakes can prevent it from working correctly. When this happens, memory that should be freed stays occupied, leading to memory leaks that slow down websites over time. Here are some of the most common causes of memory leaks in JavaScript:
1. Event Listeners
Event handlers are essential JavaScript functions that are often used to bind functions to events, such as click events or mouse events. Event listeners can also cause memory leaks if the event handler holds onto references to objects that are no longer needed. A simple example of this is a code that triggers a modal.
const button = document.getElementById("openModal");
const modal = document.getElementById("modal");

button.addEventListener("click", function () {
  modal.style.display = "block";
});
This event listener is not removed when the modal is no longer in use, the browser will keep it in memory, even if the modal element is removed from the DOM. Over time, this can slow down performance.
How to Prevent Event Handler Memory Leaks
To prevent memory leaks, always remove event listeners using `removeEventListener()` when they are no longer needed:
const button = document.getElementById("openModal");
const modal = document.getElementById("modal");

function showModal() {
  modal.style.display = "block";
}

button.addEventListener("click", showModal);

function cleanup() {
  button.removeEventListener("click", showModal);
}
2. Closure
Closures are a powerful feature in JavaScript, but they can unintentionally retain references to variables that should be freed. When a closure captures a variable from an outer scope, that variable will remain in memory as long as the closure exists.
function rememberUser() {
    let message = "Hello David, are you still there?";

    return function () {
        console.log(message);
    };
}

const saveMessage = rememberUser();
saveMessage();
Prevention
The code above logs output and retains memory, preventing garbage collection. To avoid leaks, remove references when they are no longer needed.
function rememberUser() {

    return function () {
        console.log(“Hello David, are you still there?”);
    };
}

const saveMessage = rememberUser();
saveMessage();
Setting the `message = null;` breaks the closure reference and allows JavaScript's garbage collector to free up memory.
3. Global Variables
Variables declared in the global scope remain in memory throughout the application's lifecycle, meaning they aren’t automatically removed when they are no longer needed. This can lead to unnecessary memory consumption and potential memory leaks, especially when handling large objects or data structures.
function printProfile() {
  profile = "Hi, My name is John, I'm a Software engineer";
}
printProfile();
The code example above has a leak. The profile is a global variable, and when it is declared, it remains in the application's memory.
Prevention
To fix this, limit variable scope by declaring variables inside functions. This way, JavaScript will automatically clear them after the function is done running.
function printProfile() {
  let profile = "Hi, My name is John, I'm a Software engineer";
}
printProfile();
The above code has a declared variable inside the function created using the let keyword.
4. Set Timers and Intervals
setTimeout and setInterval are used to execute functions after a delay or repeatedly at a set interval. However, if they are not properly cleared, they can cause memory leaks by holding references to objects that are no longer needed.
function startCreating() {
    let student = {
        name: "Jane Smith",
        age: 25
    };

   const intervalId = setInterval(() => {
        console.log(`Student: ${student.name}, Age: ${student.age}`);
    }, 1000);
}

startCreating();
The code above creates an interval that logs user data every second. However, if you don't stop it, the interval continues running even when the user object is no longer needed.
Prevention
To prevent memory leaks, ensure that you clear timers when they are no longer necessary. Use `clearInterval()` or `clearTimeout()` once the component or function has finished using the timer.
function startCreating() {
    let student = {
        name: "Jane Smith",
        age: 25

    };

    const intervalId = setInterval(() => {
        console.log(`Student: ${student.name}, Age: ${student.age}`);
    }, 1000);

    setTimeout(() => {
        clearInterval(intervalId);
        console.log("No more Logging and the memory is cleared forever 😄");
    }, 5000);
}

startCreating();
There are several causes of memory leaks in JavaScript, but the following are the most common mistakes developers make that lead to such leaks.
How to detect JavaScript memory leaks
Memory leaks are difficult to spot because the browser doesn’t display an error when they occur. This makes them difficult to notice and fix. However, if your website keeps getting slower over time, it could be a sign of a memory leak. The good thing is that browsers have built-in tools to help find and fix these issues.
Finding Memory Leaks with Chrome Developer Tools
Modern web browsers come with developer tools that let you check memory usage, take snapshots, and track down memory leaks. By regularly checking your website’s memory usage, you can identify problems early and prevent them from slowing down your site.
In a previous article on debugging, it was explained how to use Chrome Developer Tools for debugging JavaScript errors. Now, let’s see how these tools can help us find and fix memory leaks.
In Chrome DevTools, the most useful tool for detecting memory leaks is the Heap Snapshot feature in the Memory tab.
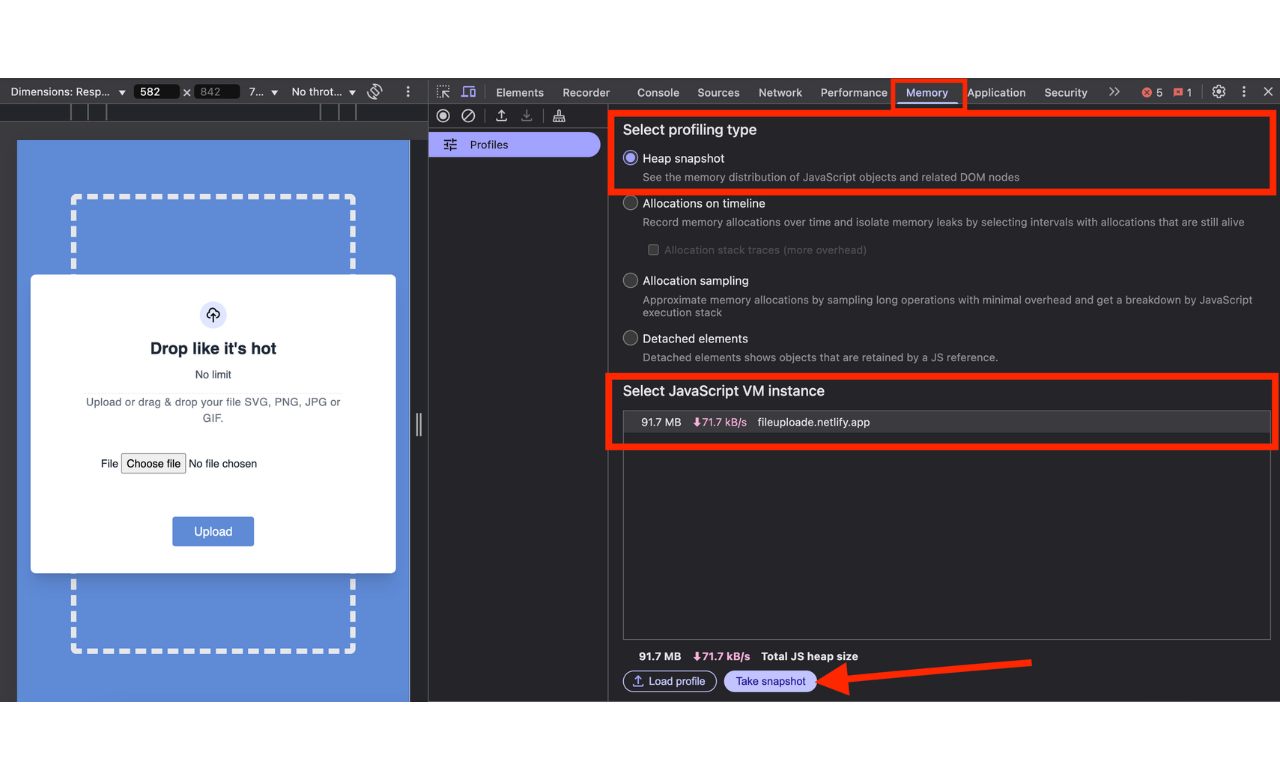 The Heap Snapshot tool enables you to capture a detailed memory report of the main thread, web workers, or iframes, allowing you to analyze how memory is being utilized.
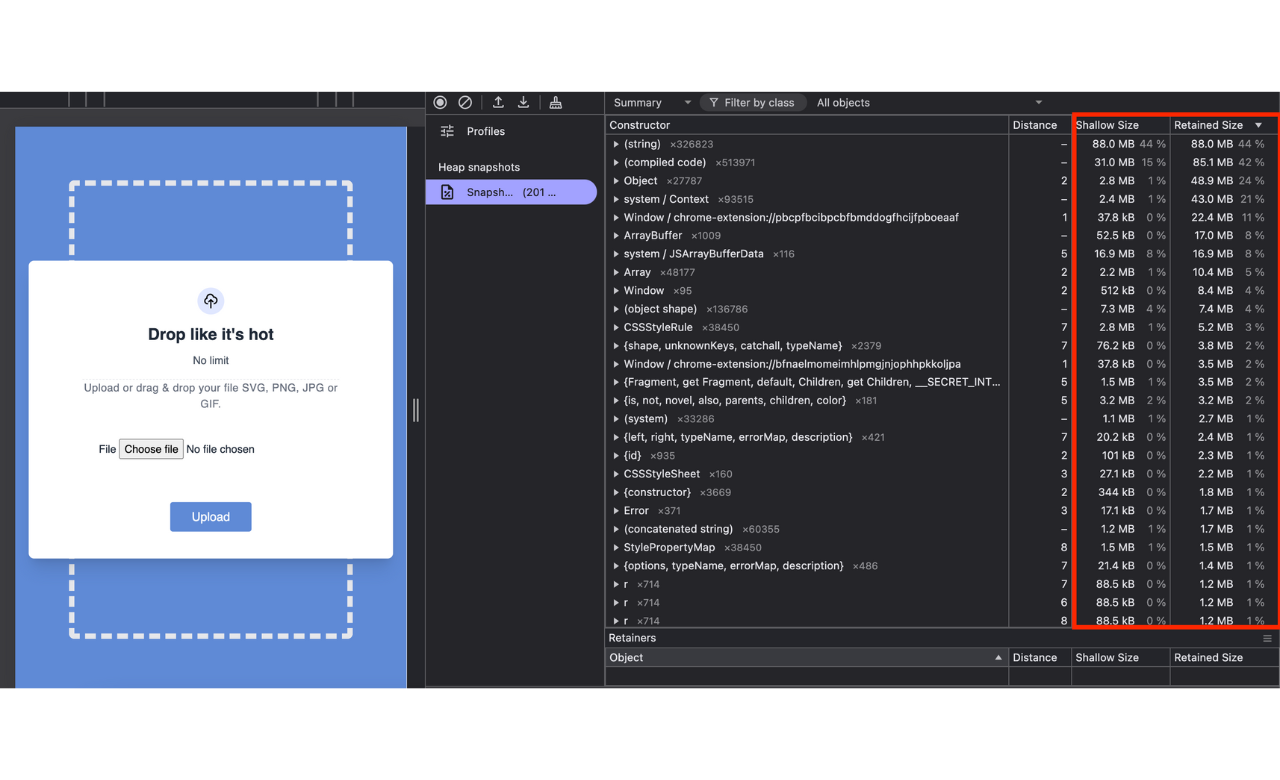
When you click the "Take Snapshot" button, Chrome DevTools records all the objects currently stored in memory on that webpage. This includes elements still linked to the window, timers like setInterval, and other active data. You can think of it as a frozen snapshot that captures how the page is using memory at that exact moment.
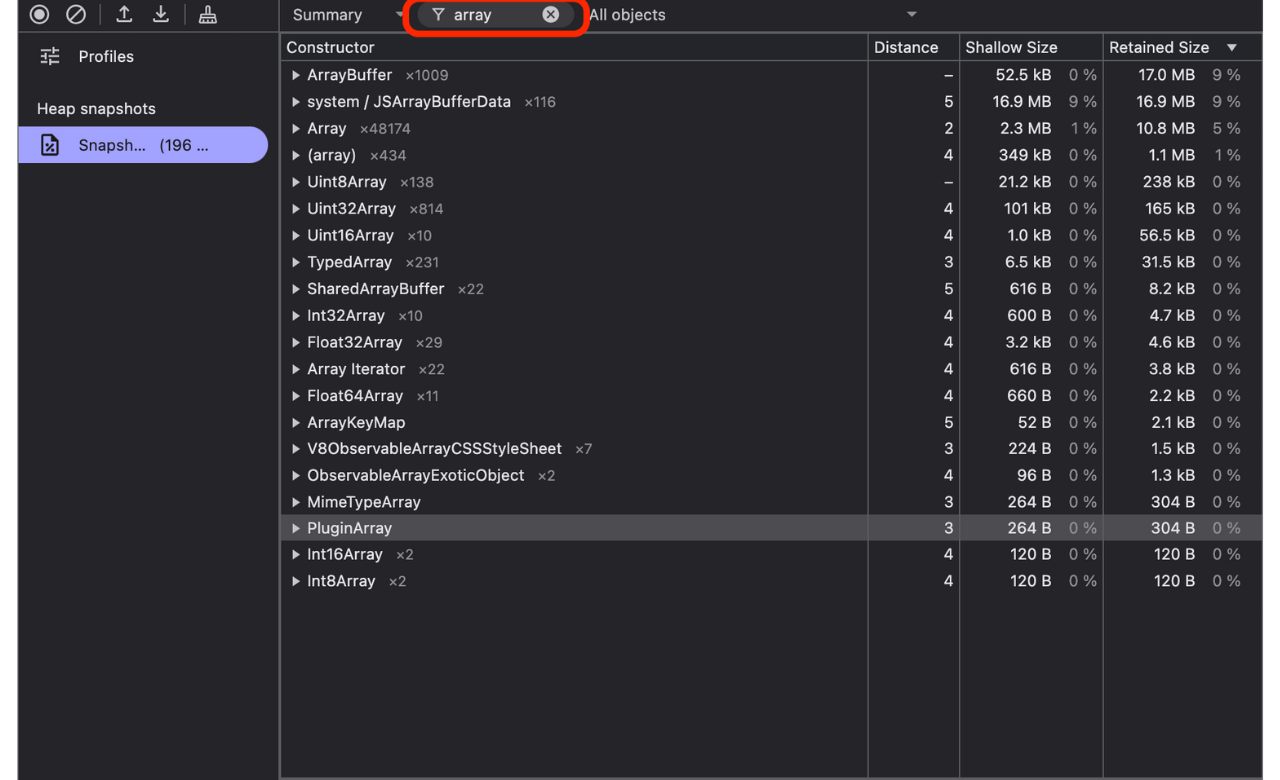
You can check these objects individually or filter by the class name to detect memory leaks.
Third-Party Tools for Detecting JavaScript Memory Leaks
In addition to built-in browser-based tools like Chrome DevTools, Firefox Developer Tools, and WebPageTest’s profiler, which provides deeper insights into performance issues, you can use third-party tools to detect and monitor memory leaks in JavaScript applications. Options like memwatch-next, leakage, Heapdump, and VisualVM help track memory usage. There are more advanced analysis tools, such as Node.js Inspector and Valgrind, that can also be useful.
Conclusion
Memory leaks in JavaScript can silently degrade application performance, leading to slow load times, increasing memory consumption over time, and even causing crashes. While common culprits, such as forgotten timers, event listeners, or closures, are often to blame, leaks can also arise from less obvious sources, including detached DOM nodes, unbounded caches, or lingering references in third-party libraries.
Understanding how these issues occur and how to detect and mitigate them is essential for building high-performance, resilient web applications. Because memory leaks can manifest in subtle and varied ways, developers should make it a habit to profile their applications regularly and stay informed about best practices.
Jscrambler
The leader in client-side Web security. With Jscrambler, JavaScript applications become self-defensive and capable of detecting and blocking client-side attacks like Magecart.
View All ArticlesMust read next
JavaScript Obfuscation: The Definitive Guide for 2026
JavaScript obfuscation is a series of code transformations that make JS extremely hard to understand and reverse-engineer. This definitive guide explores it in-depth.
January 13, 2026 | By Jscrambler | 18 min read
The Most Effective Way to Protect Client-Side JavaScript Applications
In this article, we will examine JavaScript security risks and how to protect JavaScript code on client-side applications.
May 20, 2025 | By Ejiro Thankgod | 8 min read
